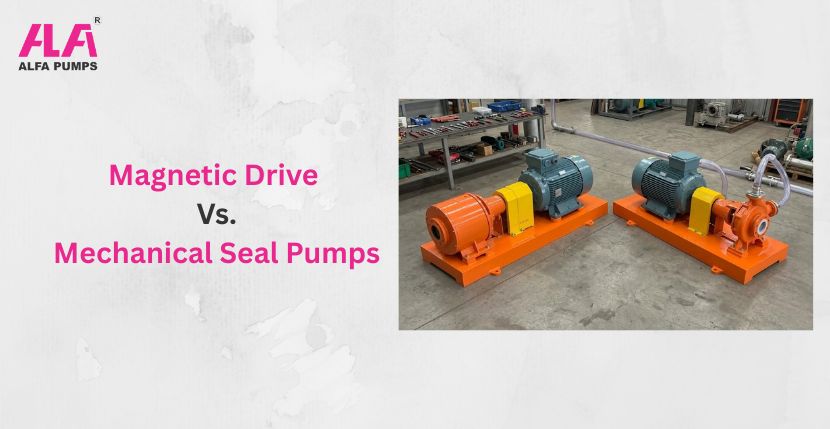
In India’s fast-growing industrial ecosystem, pump selection directly impacts profitability. This is because this sector spans infrastructure, chemicals, pharma and water management. Yet, one of the most misinterpreted tools in this process remains pump curves for centrifugal pumps. When misunderstood, they quietly drain efficiency, inflate electricity bills and shorten equipment life. In such cases, upgrading to a sealless magnetic chemical pump can significantly reduce leakage risks and improve overall system reliability.
In highly corrosive environments, selecting the right material is equally important, which is why many industries prefer PVDF cantilever pumps for handling aggressive chemicals without frequent maintenance issues.
For businesses aiming to scale without operational leakages, understanding the centrifugal pump characteristic curve is thus quite important.
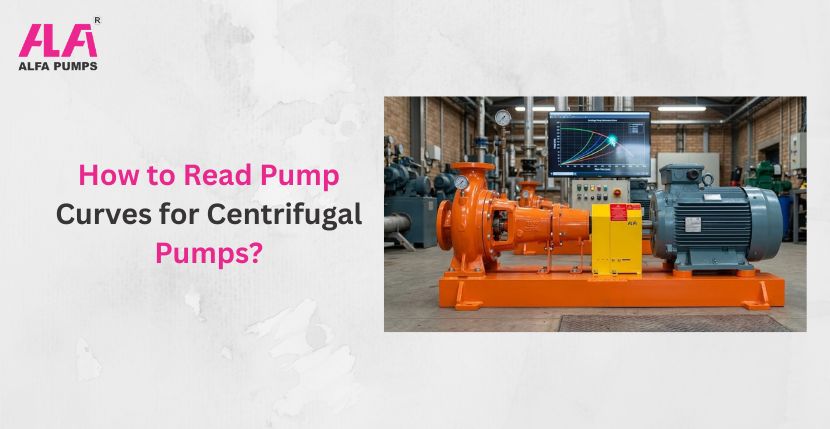
What Exactly Is a Pump Curves?
At its core, a pump curve is a performance map. The most important one, the centrifugal pump characteristic curve, shows how flow rate and head interact. This relationship, commonly referred to as the flow rate vs head curve, explains how much liquid a pump can move at a given pressure.
As flow increases, the head decreases. This simple but critical relationship governs how your system will perform under varying demand conditions.
Why Pump Curves Matter More Than You Think:
Across Indian industries, energy audits consistently reveal that nearly 60% of pumping systems operate inefficiently. A major reason is poor alignment between actual requirements and the centrifugal pump system curve.
Pump curves are not just technical graphs. Rather, they define how your system behaves in reality. They influence energy consumption, system stability, maintenance frequency and overall output reliability. Technologies like Teflon-Bellow Pumps further enhance reliability by eliminating seal-related failures and reducing maintenance requirements. When pump curves for centrifugal pumps are interpreted correctly, decision-making becomes precise.
Key Elements You Must Understand:
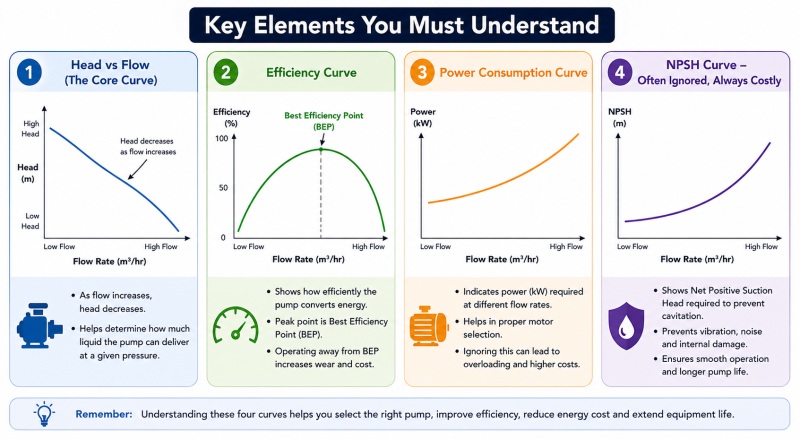
1. Head vs Flow (The Core Curve):
The flow rate vs head curve slopes downward—meaning as flow increases, head decreases. This is the most visible part of pump curves for centrifugal pumps.
In Indian applications like municipal water supply or irrigation, ignoring this curve leads to undersupply or pipe bursts due to pressure mismatch.
2. Efficiency Curve:
Overlaying the main curve is the centrifugal pump efficiency curve. This indicates how efficiently the pump converts electrical energy into hydraulic energy.
- Peak efficiency point = Best Efficiency Point (BEP)
- Operating far from BEP = higher wear, higher costs
In India, operating even 10% away from BEP can increase electricity bills by lakhs annually in mid-scale industries. This is why analysing the centrifugal pump efficiency curve is critical before procurement.
3. Power Consumption Curve:
Another layer in centrifugal pump performance curve analysis is power requirement. This curve shows how much motor power is needed at different flow rates. For Indian SMEs, this directly means increased downtime and lost revenue. Ignoring this aspect leads to:
- Motor overloading
- Frequent tripping
- Reduced equipment life
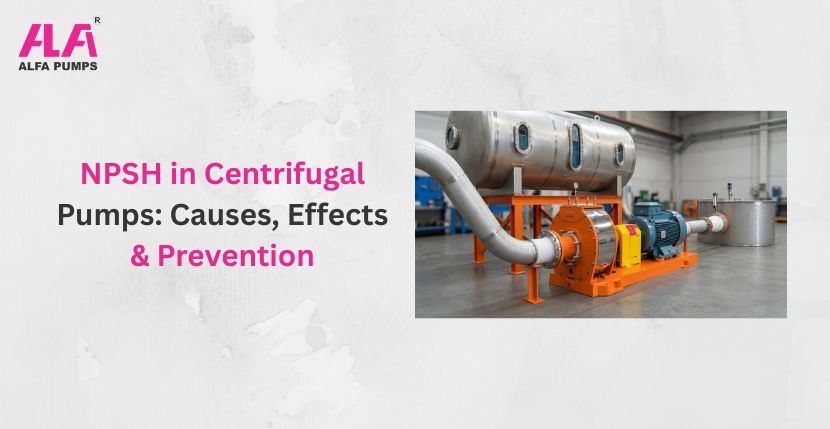
4. NPSH Curve – Often Ignored, Always Costly
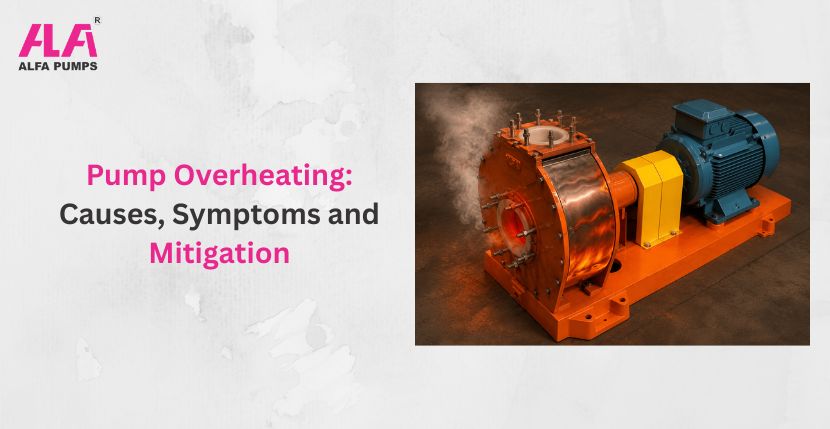
The NPSH curve defines the Net Positive Suction Head required to avoid cavitation. Cavitation in pumps is one of the biggest hidden costs in Indian pumping systems. It will be causing unnecessary vibration, noise and internal damage. Knowing pump curves for centrifugal pumps ensures:
- Smooth operation
- Longer pump life
- Reduced maintenance
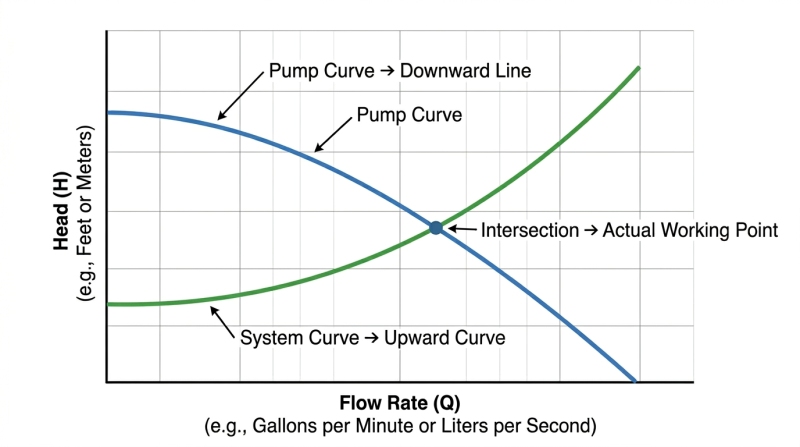
Understanding the System Curve:
While the pump has its own characteristics, your piping system creates resistance. This is captured in the centrifugal pump system curve. It reflects how factors like pipe length, diameter, fittings and elevation affect flow. The real insight emerges when comparing the system curve vs pump curve. This comparison reveals how well the pump and system are matched.
Most Critical Insight – The Operating Point
The intersection of the pump curve and the system curve determines the pump operating point. This is where the pump will actually function. If this point is misaligned, the consequences are immediate:
- Low flow and overheating when operating too far left
- Excessive wear and energy waste when operating too far right
In India, a large percentage of pump failures can be traced back to poor alignment between the centrifugal pump system curve and the pump’s actual performance.
What Pump Curves Don’t Tell You Directly (Real Field Mistakes):
In real industrial conditions, pump curves alone are not enough. For example, in highly corrosive applications, using a PFA-PVDF lined pump helps minimise internal damage and ensures long-term operational stability. Many hidden factors affect performance:
- Valve throttling changes the system curve without notice
- Seasonal water level changes affect suction conditions
- Pipeline scaling and rust increase friction over time
- Improper installation shifts operating point completely
These are common mistakes seen across Indian plants. Understanding these makes your analysis practical, not just theoretical.
Parallel and Series Pump Operation:
Many industries use multiple pumps, but few understand how curves behave.
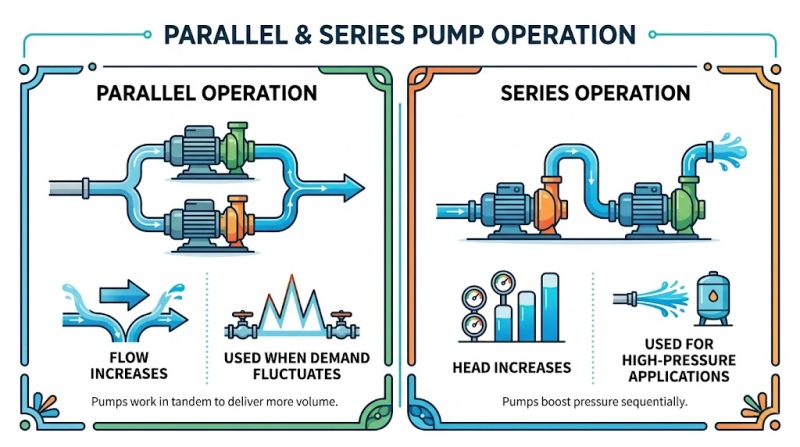
Parallel Operation:
- Flow increases
- Used when demand fluctuates
Series Operation:
- Head increases
- Used for high-pressure applications
Common Mistake:
Running multiple pumps without curve analysis leads to instability and energy waste.
Watch out for these warning signs:
- Flat curve → unstable flow
- Very steep curve → sensitive to small changes
- Operating near shut-off → overheating risk
- Operating too far right → high vibration
Read Also: Smart Ways to Boost Pump Performance and Control Energy Costs
Simple Energy Cost Impact Example in Pump Curves:
Let’s understand cost impact in simple terms:
| Condition | Result |
| Operating near BEP | Lowest electricity cost |
| 10–15% away from BEP | 10–20% higher energy cost |
| Far from BEP | Heavy energy loss + maintenance |
For a mid-size plant running 20 hours daily, this can mean lakhs of rupees per year.
Indian Case Study That Changed Results
A water treatment plant in Gujarat initially selected pumps based on rated capacity rather than analysing pump curves for centrifugal pumps. The result was predictable. They delivered higher electricity consumption, repeated mechanical issues and inconsistent output.
Once engineers recalculated the centrifugal pump system curve and matched it with the correct centrifugal pump characteristic curve, the transformation was immediate. Energy usage dropped significantly, maintenance costs reduced and system stability improved. This is the difference between theoretical selection and data-driven decision-making.
How to Read Pump Curves Step-by-Step:
Each step eliminates risk and improves system performance. Instead of approaching pump curves as complex charts, consider the following as a sequence of decisions:
- Start by determining system requirements using accurate pump head calculation, including static head and friction losses
- Locate this requirement on the flow rate vs head curve to identify suitable pump options
- Check the centrifugal pump efficiency curve and ensure the operating point is close to BEP
- Verify the pump power consumption to confirm motor compatibility
- Compare system suction conditions with the NPSH curve to avoid cavitation
- Finally, overlay the centrifugal pump system curve to validate the actual pump operating point
Where Most Indian Buyers Go Wrong:
Even experienced buyers often rely on assumptions instead of analysis.
- May overlook the centrifugal pump characteristic curve
- Ignore how the system curve vs pump curve interaction affects performance
- Or skip evaluating the centrifugal pump efficiency curve entirely.
These decisions may reduce upfront costs but lead to far higher operational expenses. In many cases, inefficiencies in pump curves for centrifugal pump interpretation result in years of avoidable losses.
Why Alfa Pumps Becomes the Smarter Choice:
At Alfa Pumps, pump selection is treated as an engineering solution. Every recommendation is built on a deep understanding of pump curves for centrifugal pumps, ensuring alignment with the actual centrifugal pump system curve and real-world operating conditions in India.
This approach delivers exact desired results in terms of ROI along with lower energy costs, improved reliability and longer equipment life. Businesses don’t just buy pumps from us, they gain performance assurance.
Final Takeaway
Most Indian industries are unknowingly bleeding money through inefficient pumping systems—and the numbers prove it. According to the Bureau of Energy Efficiency (BEE), Government of India, pumping systems account for nearly 20–25% of total industrial electricity consumption and 30–40% of that energy is wasted due to poor system design and incorrect pump selection.
In a competitive market, these figures are extremely powerful. If you are serious about getting the right, now is the time to act. Connect with us…
FAQs:
A pump curve is a graph that shows how a centrifugal pump will perform at different flow rates and pressures. It helps you understand how much water or liquid the pump can deliver in real working conditions.
Head vs flow curve shows the relationship between pressure (head) and flow rate. As flow increases, the head decreases, which is the basic working behaviour of centrifugal pumps.
BEP is the point where the pump works at maximum efficiency with minimum energy loss. Operating near BEP gives better performance, lower electricity cost and longer pump life.
Matching both curves helps you find the actual operating point of the pump. If they are not matched properly, it can lead to low performance, high energy usage and frequent failures.
NPSH (Net Positive Suction Head) ensures that the pump gets enough suction pressure to avoid cavitation. If NPSH is not proper, it can cause noise, damage and performance loss.
When a pump runs far from BEP, it consumes more electricity and causes vibration and wear. This reduces pump life and increases maintenance cost over time.
The operating point is where the pump curve and system curve intersect. This is the actual point where the pump will work in real conditions.

Mr. Sanket Patel is a visionary industrial leader and managing director of Alfa Pumps. He leads the company’s innovation in fluid handling solutions, focusing on chemical process pumps designed for corrosive fluids.